Posted by Managementguru in Accounting, Decision Making, Management Accounting, Project Management
on Apr 1st, 2014 | 0 comments
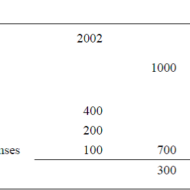
ACCOUNTING AND DECISION MAKING – IDENTIFYING THE PROBLEM SITUATION Learn accounting and finance basics so you can effectively analyze business data to make key management decisions. Business owners are faced with countless decisions every business day. Managerial accounting information provides data-driven input to these decisions, which can improve decision-making over the long term. Fig 1.1- ACCOUNTING INFORMATION FOR A SINGLE PRODUCT The above illustration clearly depicts that there has been a loss of Rs.100 in one year’s time for this particular product. The reason can be attributed to the increase in the “cost of goods” whereas other expenses have remained the same in both the years. For a single product manufactured, the problem is identifiable and solvable. But when the organization is producing a range of products, you need to apply some accounting technique by which the product losing money is identified and suitable measures are taken to cut down the escalating cost. Fig 1.2- Accouning Information for a Product Range The above illustration compares and contrasts the relationship of three products a company manufactures. It is seen that products P1 and P2 are doing well. Though the cost of sales has gone up for P1 and P2, the sales volume has also increased thus increasing the gross profit over the period of time. Here the product that has to be dealt with is P3 whose sales volume has drastically gone down, yet with the same cost of sales. When there is an increase in cost of sales, two things have to be considered. Identifying the problem-product Either cut down the production cost or increase the selling-price if the product has a real demand in the market. Uses of Accounting Data: Accounting information helps the management to arrive at make or buy decisions, to outsource production of certain components to cut down or control costs, to expand the production, to increase the sales volume or to downsize their project capacity. Techniques like Break-Even Analysis, Costing and Budgeting aid in going for the right production-mix, marketing-mix and sales target plans for the respective financial years. Aggregate Planning: As we all know planning is the key to the future and financial planning has to be given utmost importance for a production process. Aggregate planning involves translating long-term forecasted demand into specific production rates and the corresponding labor requirements for the intermediate term. It takes into consideration a period of 6 to 18 months, breaking it into work modules weekly or monthly and planning for the specific period in terms of men, material and...

Posted by Managementguru in Accounting, Decision Making, Financial Management, Management Accounting, Principles of Management
on Mar 30th, 2014 | 0 comments

TURNOVER RATIO OR ACTIVITY RATIO or ASSET MANAGEMENT RATIO Turnover ratios are also known as activity ratios or efficiency ratios with which a firm manages its current assets. The following turnover ratios can be calculated to judge the effectiveness of asset use. Inventory Turnover Ratio Debtor Turnover Ratio Creditor Turnover Ratio Assets Turnover Ratio 1. INVENTORY TURNOVER RATIO This ratio indicates whether investment in stock is efficiently used or not, in other words, the number of times the inventory has been converted into sales during the period. Thus it evaluates the efficiency of the firm in managing its inventory. It helps the financial manager to evaluate the inventory policy. It is calculated by dividing the cost of goods sold by average inventory. Inventory Turnover Ratio = Cost of goods sold / Average Inventory (or) Net Sales / Average Stock Cost of goods sold = Sales-Gross profit Average Stock =Opening stock + Closing stock/2 2. DEBTOR TURNOVER RATIO Debtors play a vital role in current assets and to a great extent determines the liquidity of a firm. This indicates the number of times average debtors have been converted into cash during a year. It is determined by dividing the net credit sales by average debtors. Debtor Turnover Ratio = Net Credit Sales / Average Trade Debtors (or) Net Credit Sales / Average Debtors – Average Bills Receivable Net credit sales = Total sales – (Cash sales + Sales return) Total debtors = [ Op.Dr. + Cl.Dr. / 2 + Op.B/R + Cl. B/R / 2] When the information about credit sales, opening and closing balances of trade debtors is not available then the ratio can be calculated by dividing total sales by closing balances of trade debtor Debtor Turnover Ratio = Total Sales / Trade Debtors Note: Bad and doubtful doubts and their provisions are not deducted from the total debtors. The higher ratio indicates that debts are being collected promptly. 3. CREDITOR TURNOVER RATIO This is also known as “Creditors Velocity”. It indicates the number of times sundry creditors have been paid during a year. It is calculated to judge the requirements of cash for paying sundry creditors. It is calculated by dividing the net credit purchases by average creditors. Creditor Turnover Ratio = Net Credit Purchases / Average Trade Creditor (or) Net Credit Purchases / Average Creditors + Average Bills Payable Net credit purchases = Total purchases – (Cash purchase + Purchase return) Total Creditors = [Op.Cr. + Cl.Cr. / 2 + Op. B/P + Cl. B/P / 2] The higher ratio should indicate that the payments are made promptly. Net credit purchases consist of gross credit purchases minus purchase return. When the information about credit purchases, opening and closing balances of trade creditors is not available then the ratio is calculated by dividing total purchases by the closing balance of trade creditors. Creditor Turnover Ratio = Total purchases / Total Trade Creditors 4. ASSETS TURNOVER RATIO The relationship between assets and sales is known as assets turnover ratio. Several assets turnover ratios can be calculated depending upon the groups of assets, which are related to sales. a) Total asset turnover. b) Net asset turnover c) Fixed asset turnover d) Current asset turnover e) Net working capital turnover ratio a. TOTAL ASSET TURNOVER This ratio shows the firms ability to generate sales from all financial resources committed to total assets. It is calculated by dividing sales by total assets. Total asset turnover = Total Sales / Total Assets b. NET ASSET TURNOVER This is calculated by dividing sales by net assets. Net asset turnover =Total Sales / Net Assets Net assets represent total assets minus current liabilities. Intangible and fictitious assets like goodwill, patents, accumulated losses, deferred expenditure may be excluded for...
Posted by Managementguru in Accounting, Financial Management, Management Accounting, Principles of Management
on Mar 30th, 2014 | 0 comments

SOLVENCY OR LEVERAGE RATIOS Long-term solvency ratios analyze the long-term financial position of the organization. Bankers and creditors are interested in the liquidity of the firm, whereas shareholders, debenture holders and financial institutions are concerned with the long term prosperity of the firm. There are thus two aspects of the long-term solvency of a firm. Ability to repay the principal amount when due Regular payment of the interest. The ratio is based on the relationship between borrowed funds and owner’s capital it is computed from the balance sheet, the second type is calculated from the profit and loss a/c. The various solvency ratios are Debt equity ratio Debt to total capital ratio Proprietary (Equity) ratio Fixed assets to net worth ratio Fixed assets to long term funds ratio Debt service (Interest coverage) ratio 1. DEBT EQUITY RATIO OR EXTERNAL – INTERNAL EQUITY RATIO Debt equity ratio shows the relative claims of creditors (Outsiders) and owners (Interest) against the assets of the firm. The relationship between borrowed fund and capital is shown in debt-equity ratio. It can be calculated by dividing outsider funds (Debt) by shareholder funds (Equity) Ebt equity ratio = Outsider Funds (Total Debts) / Shareholder Funds or Equity (or) Long-term Debts / Shareholders funds Shareholders fund = Preference capital + Equity capital + Reserves & Surplus – Goodwill & Preliminary expenses Outsiders funds = Current liabilities + Debentures + Loans The ideal ratio is 2:1. High ratio means, the claim of creditors is greater than owners and vice-versa 2. DEBT TO TOTAL CAPITAL RATIO Debt to total capital ratio = Total Debts / Total Assets 3. PROPRIETARY (EQUITY) RATIO This ratio indicates the proportion of total assets financed by owners. It is calculated by dividing proprietor (Shareholder) funds by total assets. Proprietary (equity) ratio = Shareholder funds / Total Tangible assets The ideal ratio is 1:3. A ratio below 50% may be alarming for creditors, because they incur loss during winding up. 4. FIXED ASSETS TO NET WORTH RATIO This ratio establishes the relationship between fixed assets and shareholder funds. It is calculated by dividing fixed assets by shareholder funds. Fixed assets to net worth ratio = Fixed Assets X 100 / Net Worth The shareholder funds include equity share capital, preference share capital, reserves and surplus including accumulated profits. However fictitious assets like accumulated deferred expenses etc should be deducted from the total of these items to shareholder funds. The shareholder funds so calculated are known as net worth of the business. 5. FIXED ASSETS TO LONG TERM FUNDS RATIO Fixed assets to long term funds ratio establishes the relationship between fixed assets and long-term funds and is calculated by dividing fixed assets by long term funds. Fixed assets to long term funds ratio = Fixed Assets X 100 / Long-term Funds 6. DEBT SERVICE (INTEREST COVERAGE) RATIO This shows the number of times the earnings of the firms are able to cover the fixed interest liability of the firm. This ratio therefore is also known as Interest coverage or time interest earned ratio. It is calculated by dividing the earnings before interest and tax (EBIT) by interest charges on loans. Debt Service Ratio = Earnings before interest and tax (EBIT) / Interest...
Posted by Managementguru in Accounting, Financial Management, Management Accounting, Principles of Management
on Mar 29th, 2014 | 0 comments

Profitability ratios are metrics that assess a company’s ability to generate income relative to its revenue, operating costs, balance sheet assets, or shareholders’ equity. Profitability ratios show how efficiently a company generates profit and value for shareholders. Accounting Basics for Success in Business and in Life! In general two groups of profitability ratios are calculated. Profitability in relation to sales.Profitability in relation to investments. Profitability Ratios can be Classified into five types Gross profit margin or ratioNet profit margin or ratioOperating profit margin or ratioReturn on AssetsReturn on Equity 1. GROSS PROFIT MARGIN OR RATIO It measures the relationship between gross profit and sales. It is calculated by dividing gross profit by sales. Gross profit margin or ratio = Gross profit X 100 / Net salesGross profit is the difference between sales and cost of goods sold. 2. NET PROFIT MARGIN OR RATIO It measures the relationship between net profit and sales of a firm. It indicates management’s efficiency in manufacturing, administrating, and selling the products. It is calculated by dividing net profit after tax by sales. Net profit margin or ratio = Earning after tax X 100 / Net Sales 3. OPERATING PROFIT MARGIN OR RATIO It establishes the relationship between total operating expenses and net sales. It is calculated by dividing operating expenses by the net sales. Operating profit margin or ratio = Operating costs X 100 / Net sales (0r) Cost of goods sold + Operating expenses * 100 / Net sales Operating expenses includes cost of goods produced/sold, general and administrative expenses, selling and distributive expenses. 4. RETURN ON ASSETS Return on assets is the ratio that is used to measure the company’s ability to generate profit by using its whole resource, the assets. It shows the percentage of the net income or net profit comparing to the average total assets. Return on assets shows how efficient the company is in using the assets to generate profits in a period of time. The high return on assets usually shows that the company performs well in making a profit from the assets it has. Return on assets can be calculated by comparing net income or net profit after interest and tax in the period to average total assets. Return on Assets = Net Profit / Average Total Assets 5. RETURN ON EQUITY Return on equity is the ratio that is used to measure the company’s ability to generate profit by using its investors’ money. It shows the percentage of the net income or net profit comparing to the average total equity. Return on equity shows how efficient the company is in using the investor’s money to generate profits in a period of time. The high return on equity usually shows that the company performs well in making profits from its investors’ money. Return on equity can be calculated by comparing net income or net profit after interest and tax in the period to average total equity. Return on Equity = Net Profit / Average Total...
Posted by Managementguru in Accounting, Financial Management, Management Accounting, Principles of Management
on Mar 28th, 2014 | 0 comments
ROI – Return on Investment Ratios PROFITABILITY IN RELATION TO INVESTMENTS Return on gross investment or gross capital employed Return on net investment or net capital employed Return on shareholder’s investment or shareholder’s capital employed. Return on equity shareholder investment or equity shareholder capital employed. 1. RETURN ON GROSS CAPITAL EMPLOYED This ratio establishes the relationship between net profit and the gross capital employed. The term gross capital employed refers to the total investment made in business. The conventional approach is to divide Earnings After Tax (EAT) by gross capital employed. Return on gross capital employed = Earnings After Tax (EAT) X 100 / Gross capital employed 2. RETURN ON NET CAPITAL EMPLOYED It is calculated by dividing Earnings Before Interest & Tax (EBIT) by the net capital employed. The term net capital employed in the gross capital in the business minus current liabilities. Thus it represents the long-term funds supplied by creditors and owners of the firm. Return on net capital employed = Earnings Before Interest & Tax (EBIT) X 100 / Net capital employed 3. RETURN ON SHARE CAPITAL EMPLOYED This ratio establishes the relationship between earnings after taxes and the shareholder investment in the business. This ratio reveals how profitability the owners’ funds have been utilized by the firm. It is calculated by dividing Earnings after tax (EAT) by shareholder capital employed. Return on share capital employed = Earnings after tax (EAT) X 100 / Shareholder capital employed 4. RETURN ON EQUITY SHARE CAPITAL EMPLOYED Equity shareholders are entitled to all the profits remaining after the all outside claims including dividends on preference share capital are paid in full. The earnings may be distributed to them or retained in the business. Return on equity share capital investments or capital employed establishes the relationship between earnings after tax and preference dividend and equity shareholder investment or capital employed or net worth. It is calculated by dividing earnings after tax and preference dividend by equity shareholder’s capital employed. Return on equity share capital employed = Earnings after tax (EAT), preference dividends X 100 / Equity share capital employed. The following are some of the important and basic concepts to be understood in management accounting: EARNINGS PER SHARE IT measures the profit available to the equity shareholders on a per share basis. It is computed by dividing earnings available to the equity shareholders by the total number of equity share outstanding. Earnings per share = Earnings after tax – Preferred dividends (if any) / Equity shares outstanding DIVIDEND PER SHARE The dividends paid to the shareholders on a per share basis in dividend per share. Thus dividend per share is the earnings distributed to the ordinary shareholders divided by the number of ordinary shares outstanding. Dividend per share = Earnings paid to the ordinary shareholders / Number of ordinary shares outstanding DIVIDENDS PAY OUT RATIO (PAY OUT RATIO) It measures the relationship between the earnings belonging to the equity shareholders and the dividends paid to them. It shows what percentage shares of the earnings are available for the ordinary shareholders are paid out as dividend to the ordinary shareholders. It can be calculated by dividing the total dividend paid to the equity shareholders by the total earnings available to them or alternatively by dividing dividend per share by earnings per share. Dividend pay our ratio (Pay our ratio) = Total dividend paid to equity share holders / Total earnings available to equity share holders Or Dividend per share / Earnings per share DIVIDEND AND EARNINGS YIELD While the earnings per share and dividend per share are based on the book value per share, the yield is expressed in terms...