Posted by Managementguru in Business Management, Decision Making, Financial Management, Human Resource, Principles of Management, Strategy
on Mar 30th, 2014 | 0 comments
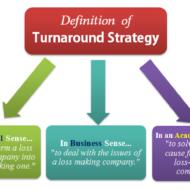
What is Turnaround Strategy Distress signals start flying around when a particular company, whether multinational, corporate or medium sized, is subjected to financial pressure and is at the brink of bankruptcy. What was happening all along? No body knows and nobody wants to be held responsible. The CEO has to bear the brunt and alas, extermination! Aim of Turn-around Strategy: The overall aim of a turn around strategy is to bring back a firm to normalcy which has been under distress in terms of acceptable levels of profitability, solvency, liquidity and cash flow. Turn around strategies should be very carefully formulated so as to stabilize the firm in distress, i.e., to bring the company out of the hole and then go for long term planning. Turn around can be in the form of operational efficiency management, financial restructuring, marketing management or savings in the form of cost reduction or liquidity in the form of asset reduction. Facebook Marketing: A Step-by-Step to Your First 1000 Fans! Turn around to see what is around: We have seen so many such occurrences at the global level and micro level. Some companies rejuvenate like a phoenix bird from the ashes, some go haywire, and some dissolve into thin air. It all depends how well you handle the situation with either the help of an external expert consultant or you might want to go for joint venture or collaboration in order to save you skin from mounting interest payments or you right royally sell the company if somebody is ready to takeover. Either way you have to do something! “Turn around to see what is around”. Don’t see what you want to see See what has to be seen Change the CEO (He is the Ideal Victim!) Resurrect your employees’ confidence Cut down costs Look for Alternatives Lie low for Sometime(till the situation favors) Slowly capture the market by innovative Campaigns and ads Paint a new picture about your company Review your Mission and Vision statements Work on targets Bang on the right target customers and clients Strengthen your Channel of Distributors Go smooth with the bankers (You need them always!) Have confidence in yourself Crisis management is necessary Stress busters like yoga and meditation mandatory Evolve Strategies One step at a time (Slow and steady) Fear and Panic grips the organization in situations of crisis. So the first step would be to stay cool to assess the situation by calmly reviewing the damage with all the concerned people. The next step would be to stop the bleeding by cutting all unwanted costs, unnecessary overheads, and the final stage would be renaissance, recovery, renewal or by whatever name you want to call it, even if it means negative investment or profit. Proper Planning, Inventory Control, Strategic prepositions, Renewal of old strategies in accordance with the situation, Tightening finance controls, Defining the credit management limits, all these are precautionary measures which will hold you from falling into the danger of handling a crisis situation, as” recovery of damaged integrity is going to cost you more than ploughing back your profits....

Posted by Managementguru in Business Management, Human Resource, Organisational behaviour, Principles of Management, Training & Development
on Mar 30th, 2014 | 0 comments

Organizational Assessment – Motive and Means Organizational assessment involves creating a picture of “what it is”. The snapshot should provide a clear view of the present position of the company and it should indicate whether there is a need to go for a change process. The data provides a baseline which can be used as a reference point to measure change in the future. Employee opinion surveys and climate surveys form a critical part of this measurement process. The key to an effective assessment is being clear about the goal of the process and being specific about the questions the intended exercise must answer. Cultural assessment: This provides information about core dimensions of organizational culture which includes satisfaction with the work itself, satisfaction with pay and benefits, opportunities for advancement, satisfaction with leadership and supervision, motivation, common values and performance commitment. If the leader proves to be aggressive, committed, value driven, so will be the employees who obviously take after their leader to fulfill his vision. The purpose behind analyzing the culture of an organization is to determine its efficiency level and to generate recommendations for continuous improvement. This exercise should not be a one-time affair as periodical inputs and feedback are excellent ways to align culture with the vision. In this way, management is better able to anticipate and prevent any potential problem, and to assess employee attitudes regularly. Survey administration: Surveys are administered to large groups of employees at one time and it is emphasized to be anonymous to erase any apprehensions in their minds. Open-ended questions allow employees to express their opinions about areas that need improvement and also the problem areas or bottlenecks that hinder their development. Report generation: The statistics collected is summarized and presented for each and every dimension covered in the survey. The report compares the organization’s current culture with previous administrations of the survey. Such open ended discussions bring out the problem areas which the management had not been previously aware of. Feedback to management and employees: The managers discuss the outcome of the survey in order to gain a better understanding of the various issues facing the organization, and decide on a plan to give feedback to their employees. This is a kind of human resource strategy which helps the management to bridge the gap between various levels of the organization and its members. Recommendations to the management: A final report submission by managers of the respective departments along with their recommendations for management’s perusal is the final step in organizational diagnosis and with the approval of “the big boss” action plans are executed that aid in improving the organizational effectiveness. The notion of this entire exercise is to provide insight into the current skill levels of the work force and to design an effective plan for performance improvement based on the assessment of total development needs....
Posted by Managementguru in Business Management, Change management, Human Resource, Organisational behaviour, Principles of Management, Project Management
on Mar 30th, 2014 | 0 comments

Effective people are preferred to rather than efficient people as the former does the right thing and the latter does things right. Redesigning your workplace not only refers to the infrastructure but also the internal factors that might affect the productivity of your firm. Big corporate firms generally face challenges in the form of Lack of co-operation between subunitsIncreasing complaints from the customersRising Operating costsDip in the moraleMajor changes in technology All these signs are indications of a not so enterprising organizational climate. And it calls for quick decision making regarding introducing some changes that bring some positive development in terms of improved efficiency and increase in productivity. Redesigning Workplace in Response to Exogenous Factors Growth of Organizations The challenges mentioned above may make an organization’s existing structure, management practice or its culture obsolete for the new situation. Growth of an organization should be a result of collaborative effort of all the units of an organization and it is objective and not subjective. An organization is comprised of different elements which interact in deciding the organizational effectiveness. The task or goal, technology, structure, people and the internal and external environment of the firm; all these coexist and hold the firm together. Be it a school, a hospital, a union, a club or a business enterprise the interactive nature of these elements make the process of managing very difficult. Medical tourism and business travel are becoming more popular in Asian countries as it increases the scope of collaboration of industries that can coexist to enjoy a win-win situation. Who is an Effective Manager ? An effective manager anticipates these challenges and proactively initializes a planned change. He strategically prepares the organization to be subject to planned change by manipulating the structure, technology and behavior. Understanding the dimensions of change helps him to manage change better as people are always resistant to change. Modern enterprises right from the start have to install and implement “systems” that are technologically most modern and hire suitable people who are techno-savvy; Because technology rules the world and the development of new software programmes and hardware components feed on themselves every day. Developing an Organization as a Whole Behavior of people is unpredictable but controllable. Individually oriented training and development programmes does not prove much to the benefit of the organization as it creates apprehensions in the minds of the individual that are related to the culture and attitude of his superior and subordinates. The idea of developing the organization as a whole through team building is a better perspective as it renews the enthusiasm of people working for you and as a team they feel more cohesive and adhered. Synergy plays its role in improving the interpersonal relationship amongst the team members. Firms are becoming more modern in their outlook. For instance, a showroom whose purpose is to showcase your products also provides entertainment by its aesthetic value. Only if the customer is impressed by the artistic way of your exhibit, will he enter your showroom. Change is inevitable and it improves the health of an organization. The focus should be on “total system change” and the orientation is towards achieving desired results as a consequence of planned activities. Flat Organizational Structure You would have come across the latest buzz word “flat organizational structure”. This is designed in order to bridge the gap between front line employees and the executive level. If there is only few levels of management, the process of communication is more effective, the art of delegation becomes mandatory and need for participation in the decision making process involves all the employees which in turn reduces bureaucracy. There is no set pattern...
Posted by Managementguru in Accounting, Decision Making, Financial Management, Management Accounting, Principles of Management
on Mar 30th, 2014 | 0 comments
TURNOVER RATIO OR ACTIVITY RATIO or ASSET MANAGEMENT RATIO Turnover ratios are also known as activity ratios or efficiency ratios with which a firm manages its current assets. The following turnover ratios can be calculated to judge the effectiveness of asset use. Inventory Turnover Ratio Debtor Turnover Ratio Creditor Turnover Ratio Assets Turnover Ratio 1. INVENTORY TURNOVER RATIO This ratio indicates whether investment in stock is efficiently used or not, in other words, the number of times the inventory has been converted into sales during the period. Thus it evaluates the efficiency of the firm in managing its inventory. It helps the financial manager to evaluate the inventory policy. It is calculated by dividing the cost of goods sold by average inventory. Inventory Turnover Ratio = Cost of goods sold / Average Inventory (or) Net Sales / Average Stock Cost of goods sold = Sales-Gross profit Average Stock =Opening stock + Closing stock/2 2. DEBTOR TURNOVER RATIO Debtors play a vital role in current assets and to a great extent determines the liquidity of a firm. This indicates the number of times average debtors have been converted into cash during a year. It is determined by dividing the net credit sales by average debtors. Debtor Turnover Ratio = Net Credit Sales / Average Trade Debtors (or) Net Credit Sales / Average Debtors – Average Bills Receivable Net credit sales = Total sales – (Cash sales + Sales return) Total debtors = [ Op.Dr. + Cl.Dr. / 2 + Op.B/R + Cl. B/R / 2] When the information about credit sales, opening and closing balances of trade debtors is not available then the ratio can be calculated by dividing total sales by closing balances of trade debtor Debtor Turnover Ratio = Total Sales / Trade Debtors Note: Bad and doubtful doubts and their provisions are not deducted from the total debtors. The higher ratio indicates that debts are being collected promptly. 3. CREDITOR TURNOVER RATIO This is also known as “Creditors Velocity”. It indicates the number of times sundry creditors have been paid during a year. It is calculated to judge the requirements of cash for paying sundry creditors. It is calculated by dividing the net credit purchases by average creditors. Creditor Turnover Ratio = Net Credit Purchases / Average Trade Creditor (or) Net Credit Purchases / Average Creditors + Average Bills Payable Net credit purchases = Total purchases – (Cash purchase + Purchase return) Total Creditors = [Op.Cr. + Cl.Cr. / 2 + Op. B/P + Cl. B/P / 2] The higher ratio should indicate that the payments are made promptly. Net credit purchases consist of gross credit purchases minus purchase return. When the information about credit purchases, opening and closing balances of trade creditors is not available then the ratio is calculated by dividing total purchases by the closing balance of trade creditors. Creditor Turnover Ratio = Total purchases / Total Trade Creditors 4. ASSETS TURNOVER RATIO The relationship between assets and sales is known as assets turnover ratio. Several assets turnover ratios can be calculated depending upon the groups of assets, which are related to sales. a) Total asset turnover. b) Net asset turnover c) Fixed asset turnover d) Current asset turnover e) Net working capital turnover ratio a. TOTAL ASSET TURNOVER This ratio shows the firms ability to generate sales from all financial resources committed to total assets. It is calculated by dividing sales by total assets. Total asset turnover = Total Sales / Total Assets b. NET ASSET TURNOVER This is calculated by dividing sales by net assets. Net asset turnover =Total Sales / Net Assets Net assets represent total assets minus current liabilities. Intangible and fictitious assets like goodwill, patents, accumulated losses, deferred expenditure may be excluded for...
Posted by Managementguru in Accounting, Financial Management, Management Accounting, Principles of Management
on Mar 30th, 2014 | 0 comments

SOLVENCY OR LEVERAGE RATIOS Long-term solvency ratios analyze the long-term financial position of the organization. Bankers and creditors are interested in the liquidity of the firm, whereas shareholders, debenture holders and financial institutions are concerned with the long term prosperity of the firm. There are thus two aspects of the long-term solvency of a firm. Ability to repay the principal amount when due Regular payment of the interest. The ratio is based on the relationship between borrowed funds and owner’s capital it is computed from the balance sheet, the second type is calculated from the profit and loss a/c. The various solvency ratios are Debt equity ratio Debt to total capital ratio Proprietary (Equity) ratio Fixed assets to net worth ratio Fixed assets to long term funds ratio Debt service (Interest coverage) ratio 1. DEBT EQUITY RATIO OR EXTERNAL – INTERNAL EQUITY RATIO Debt equity ratio shows the relative claims of creditors (Outsiders) and owners (Interest) against the assets of the firm. The relationship between borrowed fund and capital is shown in debt-equity ratio. It can be calculated by dividing outsider funds (Debt) by shareholder funds (Equity) Ebt equity ratio = Outsider Funds (Total Debts) / Shareholder Funds or Equity (or) Long-term Debts / Shareholders funds Shareholders fund = Preference capital + Equity capital + Reserves & Surplus – Goodwill & Preliminary expenses Outsiders funds = Current liabilities + Debentures + Loans The ideal ratio is 2:1. High ratio means, the claim of creditors is greater than owners and vice-versa 2. DEBT TO TOTAL CAPITAL RATIO Debt to total capital ratio = Total Debts / Total Assets 3. PROPRIETARY (EQUITY) RATIO This ratio indicates the proportion of total assets financed by owners. It is calculated by dividing proprietor (Shareholder) funds by total assets. Proprietary (equity) ratio = Shareholder funds / Total Tangible assets The ideal ratio is 1:3. A ratio below 50% may be alarming for creditors, because they incur loss during winding up. 4. FIXED ASSETS TO NET WORTH RATIO This ratio establishes the relationship between fixed assets and shareholder funds. It is calculated by dividing fixed assets by shareholder funds. Fixed assets to net worth ratio = Fixed Assets X 100 / Net Worth The shareholder funds include equity share capital, preference share capital, reserves and surplus including accumulated profits. However fictitious assets like accumulated deferred expenses etc should be deducted from the total of these items to shareholder funds. The shareholder funds so calculated are known as net worth of the business. 5. FIXED ASSETS TO LONG TERM FUNDS RATIO Fixed assets to long term funds ratio establishes the relationship between fixed assets and long-term funds and is calculated by dividing fixed assets by long term funds. Fixed assets to long term funds ratio = Fixed Assets X 100 / Long-term Funds 6. DEBT SERVICE (INTEREST COVERAGE) RATIO This shows the number of times the earnings of the firms are able to cover the fixed interest liability of the firm. This ratio therefore is also known as Interest coverage or time interest earned ratio. It is calculated by dividing the earnings before interest and tax (EBIT) by interest charges on loans. Debt Service Ratio = Earnings before interest and tax (EBIT) / Interest...