Posted by Managementguru in Economics, Financial Management, How To, Human Resource, Operations Management, Training & Development
on Mar 15th, 2015 | 0 comments
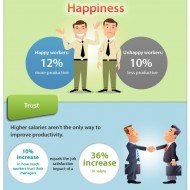
Productivity Analysis: Productivity is defined in terms of utilization of resources, like material and labor or it is the ratio of output to input. For example, productivity of labor can be measured as units produced per labor hour worked. It is closely associated with quality, technology and profitability. Now you will be able to understand why there is a strong emphasis on productivity improvement in a competitive business environment. It can be calculated at firm level, at industry level, at national level and at international level. That is what we call as GDP, NDP, and PPP. Gross Domestic Product – ‘GDP’: The monetary value of all the finished goods and services produced within a country’s borders in a specific time period, though GDP is usually calculated on an annual basis. Net Domestic Product – ‘NDP’: An annual measure of the economic output of a nation that is adjusted to account for depreciation, calculated by subtracting depreciation from the gross domestic product (GDP). Purchasing Power Parity – ‘PPP’: An economic theory that estimates the amount of adjustment needed on the exchange rate between countries in order for the exchange to be equivalent to each currency’s purchasing power. Efficiency can be improved by (a) Controlling inputs, (b) Improving process so that the same input yields higher output, and (c) By improvement of technology. Factor Productivity: When it is measured individually for each input resource to the production process it is called factor or partial productivity. Total Productivity: When it is measured for all the factors of production together, it is called total factor productivity. What are the types of Productivity Analysis? 1. Trend analysis: Studying productivity changes for the firm over a period of time. 2. Horizontal analysis: Studying efficiency in comparison with other firms of same size and involved in similar business. 3. Vertical analysis: Studying output in comparison with other industries and other firms of different sizes in the same industry. 4. Budgetary analysis: Setting up a norm for productivity for a future period as budget and planning strategies to achieve it. FACTORS AFFECTING PRODUCTIVITY 1. Capital/labor ratio: It is a measure of whether enough investment is being made in plant, machinery, and tools to make effective use of labor hours. 2. Scarcity of some resources: Resources such as energy, water and number of metals will create problems. 3. Work-force changes: Change in work-force affect productivity to a larger extent, because of the labor turnover. 4. Innovations and technology: This is the major cause of increasing productivity problems. 5. Regulatory effects: These impose substantial limitations on some firms. 6. Bargaining power: Bargaining power of organized labor to command wage has a detrimental effect. 7. Managerial factors: The planning and strategic skills of a manager play a big role in boosting the productivity of an organization. 8. Quality of work life: It is a term that describes the organizational culture, and the extent to which it motivates and satisfies employees. Here are the top 10 productivity killers in the workplace you’ll want to watch out for: 1. Cell phone/texting 2. Gossip 3. The internet 4. Social media 5. Snack breaks or smoke breaks 6. Noisy coworkers 7. Meetings 8. Email 9. Coworkers dropping by 10. Coworkers putting calls on...

Posted by Managementguru in THE GMAT
on Mar 9th, 2015 | 0 comments
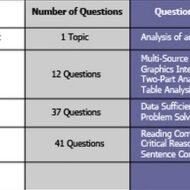
An Intro to GMAT – The WHAT and WHY The GMAT exam positions you for success in your career and a high score on the GMAT or GRE can make or break your acceptance into a top business school . Learn why the GMAT exam is the test of choice among students worldwide, and why employers demand and appreciate the skills determined by the GMAT exam. Preparing for the test necessitates learning the ins and outs of the exam and having a perfect study plan to be a star performer. What is the GMAT exam, and who must take it? The Graduate Management Admission Test is a 3½-hour standardized exam intended to gauge how test takers will perform academically in MBA (Masters in Business Administration) programs. GMAT scores are used by graduate business schools to make admission decisions. It is also referred to as the GMAT CAT. The acronym CAT stands for Computer Adaptive Test. Essentially, only two of the exam’s four sections (Quantitative and Verbal) are computer-adaptive. The GMAT can be taken only by computer now, except that in certain remote locations outside North America a paper-based version of the exam is available instead. The GRE is a general entrance test for graduate school applicants, while the GMAT is specifically for prospective business school students. Sitting for one of these two exams is a requirement for most MBA programs. Why the GMAT Exam? Acknowledged by more than 6,000 business and management programs worldwide, for nearly 60 years, the GMAT exam has been the choice of students for the simple fact that, no other exam lets you showcase the skills that matter most in the business school classroom and in your career. Business schools use and trust the GMAT exam to make admissions decisions. This competitive exam – created by the Graduate Management Admission Council (GMAC), the global non-profit council of business schools – sets the standard for its ability to predict success in the classroom. The GMAT exam measures the skills you possess and the skills schools demand. It serves as a platform to showcase the skills that matter most – to schools and businesses – with the GMAT exam’s unique Integrated Reasoning section. The GMAT exam is relied on more by graduate business schools worldwide. The GMAT exam works – for you and them – and is accepted by more programs and schools than any other individual graduate management school exam. “Winning is not a sometime thing; it’s an all time thing. You don’t win once in a while, you don’t do things right once in a while, you do them right all the time. Winning is habit. Unfortunately, so is losing.” — Vince...
Posted by Managementguru in Management Accounting
on Mar 8th, 2015 | 0 comments

Gross Profit It is a required income statement entry that indicates total revenue minus cost of goods sold. It is the company’s profit before operating expenses, interest payment and taxes. It is also known as GROSS MARGIN. The gross profit on a product is computed as: Net Sales – Cost of Goods Sold (COGS) This concept is well understood if you are able to clearly distinguish between variable and fixed costs. VARIABLE COSTS: Materials used Direct labor Packaging Freight Plant supervisor salaries Utilities for a plant or a warehouse Depreciation expense on production equipment Machinery FIXED COSTS: Fixed costs generally are more static in nature. They include: Office expenses such as supplies, utilities, a telephone for the office, etc. Salaries and wages of office staff, salespeople, officers and owners Payroll taxes and employee benefits Advertising, promotional and other sales expenses Insurance Auto expenses for salespeople Professional fees Rent Variable expenses are logged as cost of goods sold. Fixed expenses are counted as operating expenses (sometimes called selling and general administrative expenses). While gross profit is a monetary entity, the margin is expressed as a percentage. It’s equally significant to track since it allows you to keep an eye on profitability trends. Gross Profit Ratio = Gross Profit / Net Sales The gross profit margin is computed as follows: When the ratio is expressed in percentage form, it is known as gross profit margin or percentage. Gross Profit / Net Sales *100 = Gross Profit Margin It is equal to the net sales minus cost of goods sold and net sales are equal to total gross sales less return inwards and discount allowed. Benefits of calculating gross profit: This ratio determines how efficiently the management utilizes labor and raw materials A company uses its gross income to fund activities such as research and development, marketing etc., which are vital for generating future sales. A prolonged decline in this margin is a cleat-cut indication of sales drop-down and ultimately earnings. Trends in this margin reflect basic pricing decisions and material costs of a company. This profit margin is an accounting measure designed to estimate the financial health of a business or industry. It may be noted that generating a profit margin alone cannot vouch for the financial health of a firm; rather the business must have sufficient cash flow in order to pay its bills and compensate employees. An entrepreneur might compare the return that would be available from a bank or another low-risk investment opportunity to that of his EXISTING profit-margin to gauge whether his startup is doing well. → Profitability...
Posted by Managementguru in Glossary, Strategy
on Mar 5th, 2015 | 0 comments

The following is a list of “Key Terms of #Strategic Management” which find their use often when trying to explain the concepts. #Mission An important undertaking that an organization believes it is its duty to do. A specific task or duty assigned to a person or group of people. Missions tend to be long-term and laid out in broad terms, without attempts being made to quantify them precisely. #MISSION STATEMENT Mission statement An open statement of the aims and #objectives of a business or an organization – providing employees with an indication of what they are attempting to achieve through their collective deeds. Mission statements are intended to give substance to the perceived purposes of the organization. Vision Statement A Vision Statement defines what your business will do and why it will exist tomorrow and it has defined #goals to be accomplished by a set date. A Vision Statement takes into account the current status of the organization, and serves to point the direction of where the organization wishes to go. Objective Something which an organization intends to do or achieve; a result that the organization intends to make happen. Long-term or short-term objective, which you hope to achieve within a few years or a few months. Objectives and aims tend to be medium-term and more specific in terms of what is intended to be achieved. SMART OBJECTIVES #Strategy A #plan of future action, usually long-term, in the pursuit of objectives. (e.g.) business strategy; company strategy; financial strategy. The formulation of long-term plans and policies by a firm which inter-connects its various production and marketing activities in order to achieve its business objectives. STRATEGY GENERATION #Aim A result that an organization’s plans or actions are intended to achieve. (e.g.) To try to do something: we aim to be No. 1 in the market in three years’ time. Goal An organization’s aim, objective or purpose. Goals and targets tend to be medium-term or short-term and may be expressed in terms of specific levels of achievements and tend to involve more specific quantification and deadlines. (e.g.) our goal is to break even within twelve months. GOALS VS. OBJECTIVES #Target A level or situation which an organization intends to achieve or aim at. An object or area aimed at the object of an attack or takeover bid. A fixed goal or objective, etc. #Tactics The plans followed to achieve a particular short-term aim. (a) The science and art of disposing and maneuvering forces in combat. (b) The art or skill of employing available means to accomplish an end. (c) A system or mode of procedure TACTICS OR STRATEGY? Plan A set of decisions about how an organization intends to do something, or to ensure that an event or result should happen in the future. Organized way of doing something: contingency plan, government’s economic plans. Plans tend to be quite specific (the shorter-term they are, the more specific they tend to be) and are usually quantified in some detail. They will, in order to ensure that they are complied with, lay out specific deadlines for each key stage. They may also involve the consideration or analysis of priorities and constraints. STRATEGIC PLANNING #Budget A #financial plan, which may be short-term or longer-term, showing probable (planned) #income and #expenditure. Budgets tend to be expressed mainly in monetary terms, although they may focus on the amounts of physical resources (materials, labor time) required. An estimate of income and expenditure for a future period, as opposed to an account, which records financial transactions after the event. BUDGET...
Posted by Managementguru in Business Management, Decision Making, Financial Management, Marketing, Sales, Startups, Strategy
on Mar 4th, 2015 | 0 comments

A popular “Corporate Portfolio Analysis” technique is the result of pioneering effort of General Electric Company along with McKinsey Consultants which is known as the GE NINE CELL MATRIX. GE Nine-Box Matrix This is a strategy tool that offers a systematic approach for the multi business enterprises. It helps them to prioritize their investments among the various business units. It is a framework that evaluates business portfolio and provides further strategic implications. Each business is appraised in terms of two major dimensions – Market Attractiveness and Business Strength. If one of these factors is missing, then the business will not produce desired results. Neither a strong company operating in an unattractive market, nor a weak company operating in an attractive market will do very well. The vertical axis denotes industry attractiveness, which is a weighted composite rating based on eight different factors. They are: Market size and growth rateIndustry profit margins Intensity of Competition Seasonality Product Life Cycle Changes Economies of scale Technology Social, Environmental, Legal and Human Impacts What Does the Horizontal Axis Represent? It indicates business strength or in other words competitive position, which is again a weighted composite rating based on seven factors as listed below: Relative Market ShareProfit margins Ability to compete on price and qualityKnowledge of customer and market Competitive strength and weakness Technological capability Caliber of management The two composite values for industry attractiveness and competitive position are plotted for each strategic business unit (SBU) in a COMPANY’S PORTFOLIO. The PIE chart (circles) denotes the proportional size of the industry and the dark segments denote the company’s respective market share. The green zone suggests you to ‘go ahead’, to grow and build, pushing you through expansion strategies. Businesses in the green zone attract major investment. Red indicates that you have to adopt turnover strategies of divestment and liquidation or rebuilding approach. Advantages Helps to prioritize the limited resources in order to achieve the best returns.The performance of products or business units becomes evident. It’s more sophisticated business portfolio framework than the BCG matrix. Determines the strategic steps the company needs to adopt to improve the performance of its business portfolio. Disadvantages Needs a consultant or an expert to determine industry’s attractiveness and business unit strength as accurately as possible.It is expensive to conduct. It doesn’t take into account the harmony that could exist between two or more business units. PORTER’S FIVE FORCES-INDUSTRY...