Currently Browsing: Accounting
Posted by Managementguru in Business Management, Financial Accounting, Financial Management, Principles of Management
on Apr 10th, 2014 | 0 comments
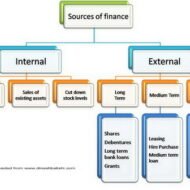
Unsecured and Secured Short Term Sources Unsecured Non-Bank Short Term Sources Commercial Paper: Short-term, unsecured promissory notes, generally issued by large corporations, with maturities of a few days to 270 days. Usually issued in multiples of $100,000 or more. Commercial paper market is composed of the (1) dealer and (2) direct-placement markets. Advantage: Cheaper than a short-term business loan from a commercial bank. Dealers require a line of credit to ensure that the commercial paper is paid off. Private Loans: A short term unsecured loan may be taken from a wealthy shareholder, a major supplier, or other parties interested in assisting the firm through a short term difficulty. Cash Advances for Customers: A customer may pay for all or a portion of future purchases before receiving the goods. This aids the firm to purchase raw materials and produce the final goods. This form of financing is a special arrangement for expensive or custom-made items that would strain the financial resources of the manufacturing company. Secured Short-term Sources: Security (collateral) — Asset (s) is pledged by a borrower to ensure repayment of a loan. If the borrower defaults, the lender may sell the security to pay off the loan. Collateral value depends on: Marketability Life Riskiness Types of Inventory Backed Loans: Field Warehouse Receipt — A receipt for goods segregated and stored on the borrower’s premises (but under the control of an independent warehousing company) that a lender holds as collateral for a loan. Terminal Warehouse Receipt — A receipt for the deposit of goods in a public warehouse that a lender holds as collateral for a loan. Trust Receipt – This loan is secured by specific and easily identified collateral that remains in the control or physical possession of the borrower. A security device acknowledging that the borrower holds specifically identified inventory and proceeds from its sale in trust for the lender. Example: When automobile dealers use this kind of financing for the cars in their showrooms or in stock, it is called floor planning. As implied by the name, this kind of loan requires a considerable degree of trust in the honesty and integrity of the borrower. Once the inventory is sold or the receivable is collected, payment must be remitted to the lender. If there is a default, the loan is said to be secured by bogus collateral. These loans are common when the collateral is easily identified by description or serial number and then each item of collateral has relatively large dollar value. Floating Lien — A general, or blanket, lien against a group of assets, such as inventory or receivables, without the assets being specifically identified Chattel Mortgage — A lien on specifically identified personal property (assets other than real estate) backing a loan. Financial Institutions: Primary sources of secured short term financing are banks and financial institutions, including insurance companies, finance companies, and the financial subsidiaries of major corporations. The best mix of short-term financing depends on: Cost of the financing method Availability of funds Timing Flexibility Degree to which the assets are encumbered It is always better to go for bank loans or loans from established and long standing private institutions because there is a leverage for the debtors to sit for discussions to sort out issued in case of defaults. All banks in India are trying to close accounts labeled under NPA- Non Performing assets either by recovering the money through one time settlement (OTS) or by auctioning the collaterals pledged during the time of loan sanctioning. If you happen to take loans from individuals or third-parties, you cannot enjoy this comfort or breather. Some Finance Quotes and Sayings for You: A...

Posted by Managementguru in Business Management, Financial Accounting, Financial Management, Principles of Management
on Apr 8th, 2014 | 0 comments
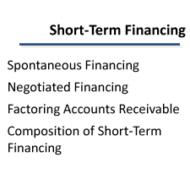
Interest Free Sources and Unsecured Interest Bearing Sources A firm obtains its funds from a variety of sources. Some capital is provided by suppliers, creditors, and owners, while other funds arise from earnings retained in business. In this segment, let me explain to you the sources of short-term funds supplied by creditors. Characteristics of short-term financing: Cost of Funds: Some forms of short-term financing may prove to be expensive than that of intermediate and long-term financing while some short-term sources like Accruals and Payables provide funds at no cost to the firm. Rollover Effect: Short-term finance as the name indicates must be repaid within a period of one year – though some sources provide funds that are constantly rolled over. The funds provided by payables, may remain relatively constant because, as some accounts are paid, other accounts are created. Clean-up: This happens when commercial banks or other lenders demand the firm to pay-off its short term obligation at one point in a financial year. Goals of Short-Term Financing: Funds are needed to finance inventories during a production period. Short term funds facilitate flexibility wherein, it meets the fluctuating needs for funds over a given cycle, commonly 1 year. To achieve low-cost financing due to interest free loans. Cash flow from operations may not be sufficient to keep up with growth-related financing needs Interest Free Sources: Accounts Payable Accounts payable are created when the firm purchases raw material, supplies, or goods for resale on credit terms without signing a formal note for the liability. These purchases on “open account” are, for most firms, the single largest source of short-term financing. Payables represent an unsecured form of financing since no specific assets are pledged as collateral for the liability. Even though no formal note is signed, an accounts payable is a legally binding obligation of a firm. Postponing payment beyond the end of the net (credit) period is known as “stretching accounts payable” or “leaning on the trade.” Possible costs of “stretching accounts payable” are Cost of the cash discount (if any) forgone Late payment penalties or interest Deterioration in credit rating Accruals: These are short term liabilities that arise when services are received but payment has not yet been made. The two primary accruals are wages payable and taxes payable. Employees work for a week, 2 weeks or a month before receiving a paycheck. The salaries or wages, plus the taxes paid by the firm on those wages, offer a form of unsecured short-term financing for the firm. The Government provides strict rules and procedures for the payment of withholding and social security taxes, so that the accrual of taxes cannot be readily manipulated. It is however, possible to change the frequency of paydays to increase or decrease the amount of financing through wages accrual. Wages — Benefits accrue via no direct cash costs, but costs can develop by reduced employee morale and efficiency. Taxes — Benefits accrue until the due date, but costs of penalties and interest beyond the due date reduce the benefits. Unsecured Interest Bearing Sources: Self-Liquidating Bank Loans The bank provides funds for a seasonal or cyclic business peak and the money is used to finance an activity that will generate cash to pay off the loan. Borrowed Funds → Finance Inventory → Peak Sales Season → Receivables → Cash → Pay Off the Loan. Three types of unsecured short-term bank loans: Single payment note – A short-term, one-time loan made to a borrower who needs funds for a specific purpose for a short period of time. Line of Credit – An informal arrangement between a bank and its customer specifying the maximum amount of...
Posted by Managementguru in Financial Accounting, Financial Management, Management Accounting
on Apr 3rd, 2014 | 0 comments
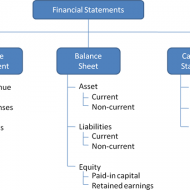
Ratio Calculation From Financial Statement Profit and Loss a/c of Beta Manufacturing Company for the year ended 31st March 2010. Exercise Problem1 Kindly download this link to view the exercise. Given in pdf format. You are required to find out: a) #Gross Profit Ratio b) #Net Profit Ratio c) #Operating Ratio d) Operating #Net Profit to Net Sales Ratio a. GROSS FORFIT RATIO = Gross profit ÷ #Sales × 100 = 50,000 ÷ 1,60,000 × 100 = 31.25 % b. #NET PROFIT RATIO = Net profit ÷ Sales × 100 = 28,000 ÷ 1,60,000 × 100 = 17.5 % c. OPERATING RATIO = #Cost of goods sold + Operating expenses ÷ Sales × 100 Cost of goos sold = Sales – Gross profit = 1,60,000 – 50,000 = Rs. 1,10,000 Operating expenses = 4,000 + 22,800 + 1,200 = Rs. 28,000 Operating ratio = 1,10,000 + 28,000 ÷ 1,60,000 × 100 = 86.25 % d. OPERATING NET PROFIT TO NET SALES RATIO = Operating Profit ÷ Sales × 100 Operating profit = Net profit + Non-Operating expenses – Non operating income = 28,000 + 800 – 4,800 = Rs. 32,000 Operating Net Profit to Net Sales Ratio = 32,000 ÷ 1,60,000 × 100 = 20 % What is a Financial statement? It is an organised collection of data according to logical and consistent #accounting procedure. It combines statements of balance sheet, income and retained earnings. These are prepared for the purpose of presenting a periodical report on the program of investment status and the results achieved i.e., the balance sheet and P& L a/c. Objectives of Financial Statement Analysis: To help in constructing future plans To gauge the earning capacity of the firm To assess the financial position and performance of the company To know the #solvency status of the firm To determine the #progress of the firm As a basis for #taxation and fiscal policy To ensure the legality of #dividends Financial Statement Analysis Tools Comparative Statements Common Size Statements #Trend Analysis #Ratio Analysis Fund Flow Statement Cash Flow Statement Types of Financial Analysis Intra-Firm Comparison Inter-firm Comparison Industry Average or Standard Analysis Horizontal Analysis Vertical Analysis Limitations Lack of Precision Lack of Exactness Incomplete Information Interim Reports Hiding of Real Position or Window Dressing Lack of Comparability Historical...
Posted by Managementguru in Accounting, Decision Making, Management Accounting, Project Management
on Apr 1st, 2014 | 0 comments
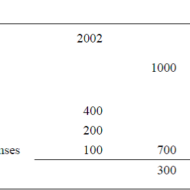
ACCOUNTING AND DECISION MAKING – IDENTIFYING THE PROBLEM SITUATION Learn accounting and finance basics so you can effectively analyze business data to make key management decisions. Business owners are faced with countless decisions every business day. Managerial accounting information provides data-driven input to these decisions, which can improve decision-making over the long term. Fig 1.1- ACCOUNTING INFORMATION FOR A SINGLE PRODUCT The above illustration clearly depicts that there has been a loss of Rs.100 in one year’s time for this particular product. The reason can be attributed to the increase in the “cost of goods” whereas other expenses have remained the same in both the years. For a single product manufactured, the problem is identifiable and solvable. But when the organization is producing a range of products, you need to apply some accounting technique by which the product losing money is identified and suitable measures are taken to cut down the escalating cost. Fig 1.2- Accouning Information for a Product Range The above illustration compares and contrasts the relationship of three products a company manufactures. It is seen that products P1 and P2 are doing well. Though the cost of sales has gone up for P1 and P2, the sales volume has also increased thus increasing the gross profit over the period of time. Here the product that has to be dealt with is P3 whose sales volume has drastically gone down, yet with the same cost of sales. When there is an increase in cost of sales, two things have to be considered. Identifying the problem-product Either cut down the production cost or increase the selling-price if the product has a real demand in the market. Uses of Accounting Data: Accounting information helps the management to arrive at make or buy decisions, to outsource production of certain components to cut down or control costs, to expand the production, to increase the sales volume or to downsize their project capacity. Techniques like Break-Even Analysis, Costing and Budgeting aid in going for the right production-mix, marketing-mix and sales target plans for the respective financial years. Aggregate Planning: As we all know planning is the key to the future and financial planning has to be given utmost importance for a production process. Aggregate planning involves translating long-term forecasted demand into specific production rates and the corresponding labor requirements for the intermediate term. It takes into consideration a period of 6 to 18 months, breaking it into work modules weekly or monthly and planning for the specific period in terms of men, material and...
Posted by Managementguru in Accounting, Decision Making, Financial Management, Management Accounting, Principles of Management
on Mar 30th, 2014 | 0 comments

TURNOVER RATIO OR ACTIVITY RATIO or ASSET MANAGEMENT RATIO Turnover ratios are also known as activity ratios or efficiency ratios with which a firm manages its current assets. The following turnover ratios can be calculated to judge the effectiveness of asset use. Inventory Turnover Ratio Debtor Turnover Ratio Creditor Turnover Ratio Assets Turnover Ratio 1. INVENTORY TURNOVER RATIO This ratio indicates whether investment in stock is efficiently used or not, in other words, the number of times the inventory has been converted into sales during the period. Thus it evaluates the efficiency of the firm in managing its inventory. It helps the financial manager to evaluate the inventory policy. It is calculated by dividing the cost of goods sold by average inventory. Inventory Turnover Ratio = Cost of goods sold / Average Inventory (or) Net Sales / Average Stock Cost of goods sold = Sales-Gross profit Average Stock =Opening stock + Closing stock/2 2. DEBTOR TURNOVER RATIO Debtors play a vital role in current assets and to a great extent determines the liquidity of a firm. This indicates the number of times average debtors have been converted into cash during a year. It is determined by dividing the net credit sales by average debtors. Debtor Turnover Ratio = Net Credit Sales / Average Trade Debtors (or) Net Credit Sales / Average Debtors – Average Bills Receivable Net credit sales = Total sales – (Cash sales + Sales return) Total debtors = [ Op.Dr. + Cl.Dr. / 2 + Op.B/R + Cl. B/R / 2] When the information about credit sales, opening and closing balances of trade debtors is not available then the ratio can be calculated by dividing total sales by closing balances of trade debtor Debtor Turnover Ratio = Total Sales / Trade Debtors Note: Bad and doubtful doubts and their provisions are not deducted from the total debtors. The higher ratio indicates that debts are being collected promptly. 3. CREDITOR TURNOVER RATIO This is also known as “Creditors Velocity”. It indicates the number of times sundry creditors have been paid during a year. It is calculated to judge the requirements of cash for paying sundry creditors. It is calculated by dividing the net credit purchases by average creditors. Creditor Turnover Ratio = Net Credit Purchases / Average Trade Creditor (or) Net Credit Purchases / Average Creditors + Average Bills Payable Net credit purchases = Total purchases – (Cash purchase + Purchase return) Total Creditors = [Op.Cr. + Cl.Cr. / 2 + Op. B/P + Cl. B/P / 2] The higher ratio should indicate that the payments are made promptly. Net credit purchases consist of gross credit purchases minus purchase return. When the information about credit purchases, opening and closing balances of trade creditors is not available then the ratio is calculated by dividing total purchases by the closing balance of trade creditors. Creditor Turnover Ratio = Total purchases / Total Trade Creditors 4. ASSETS TURNOVER RATIO The relationship between assets and sales is known as assets turnover ratio. Several assets turnover ratios can be calculated depending upon the groups of assets, which are related to sales. a) Total asset turnover. b) Net asset turnover c) Fixed asset turnover d) Current asset turnover e) Net working capital turnover ratio a. TOTAL ASSET TURNOVER This ratio shows the firms ability to generate sales from all financial resources committed to total assets. It is calculated by dividing sales by total assets. Total asset turnover = Total Sales / Total Assets b. NET ASSET TURNOVER This is calculated by dividing sales by net assets. Net asset turnover =Total Sales / Net Assets Net assets represent total assets minus current liabilities. Intangible and fictitious assets like goodwill, patents, accumulated losses, deferred expenditure may be excluded for...