Posted by Managementguru in Management Accounting
on Mar 8th, 2015 | 0 comments

Gross Profit It is a required income statement entry that indicates total revenue minus cost of goods sold. It is the company’s profit before operating expenses, interest payment and taxes. It is also known as GROSS MARGIN. The gross profit on a product is computed as: Net Sales – Cost of Goods Sold (COGS) This concept is well understood if you are able to clearly distinguish between variable and fixed costs. VARIABLE COSTS: Materials used Direct labor Packaging Freight Plant supervisor salaries Utilities for a plant or a warehouse Depreciation expense on production equipment Machinery FIXED COSTS: Fixed costs generally are more static in nature. They include: Office expenses such as supplies, utilities, a telephone for the office, etc. Salaries and wages of office staff, salespeople, officers and owners Payroll taxes and employee benefits Advertising, promotional and other sales expenses Insurance Auto expenses for salespeople Professional fees Rent Variable expenses are logged as cost of goods sold. Fixed expenses are counted as operating expenses (sometimes called selling and general administrative expenses). While gross profit is a monetary entity, the margin is expressed as a percentage. It’s equally significant to track since it allows you to keep an eye on profitability trends. Gross Profit Ratio = Gross Profit / Net Sales The gross profit margin is computed as follows: When the ratio is expressed in percentage form, it is known as gross profit margin or percentage. Gross Profit / Net Sales *100 = Gross Profit Margin It is equal to the net sales minus cost of goods sold and net sales are equal to total gross sales less return inwards and discount allowed. Benefits of calculating gross profit: This ratio determines how efficiently the management utilizes labor and raw materials A company uses its gross income to fund activities such as research and development, marketing etc., which are vital for generating future sales. A prolonged decline in this margin is a cleat-cut indication of sales drop-down and ultimately earnings. Trends in this margin reflect basic pricing decisions and material costs of a company. This profit margin is an accounting measure designed to estimate the financial health of a business or industry. It may be noted that generating a profit margin alone cannot vouch for the financial health of a firm; rather the business must have sufficient cash flow in order to pay its bills and compensate employees. An entrepreneur might compare the return that would be available from a bank or another low-risk investment opportunity to that of his EXISTING profit-margin to gauge whether his startup is doing well. → Profitability...

Posted by Managementguru in Financial Accounting, Financial Management, Management Accounting
on Apr 3rd, 2014 | 0 comments
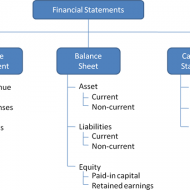
Ratio Calculation From Financial Statement Profit and Loss a/c of Beta Manufacturing Company for the year ended 31st March 2010. Exercise Problem1 Kindly download this link to view the exercise. Given in pdf format. You are required to find out: a) #Gross Profit Ratio b) #Net Profit Ratio c) #Operating Ratio d) Operating #Net Profit to Net Sales Ratio a. GROSS FORFIT RATIO = Gross profit ÷ #Sales × 100 = 50,000 ÷ 1,60,000 × 100 = 31.25 % b. #NET PROFIT RATIO = Net profit ÷ Sales × 100 = 28,000 ÷ 1,60,000 × 100 = 17.5 % c. OPERATING RATIO = #Cost of goods sold + Operating expenses ÷ Sales × 100 Cost of goos sold = Sales – Gross profit = 1,60,000 – 50,000 = Rs. 1,10,000 Operating expenses = 4,000 + 22,800 + 1,200 = Rs. 28,000 Operating ratio = 1,10,000 + 28,000 ÷ 1,60,000 × 100 = 86.25 % d. OPERATING NET PROFIT TO NET SALES RATIO = Operating Profit ÷ Sales × 100 Operating profit = Net profit + Non-Operating expenses – Non operating income = 28,000 + 800 – 4,800 = Rs. 32,000 Operating Net Profit to Net Sales Ratio = 32,000 ÷ 1,60,000 × 100 = 20 % What is a Financial statement? It is an organised collection of data according to logical and consistent #accounting procedure. It combines statements of balance sheet, income and retained earnings. These are prepared for the purpose of presenting a periodical report on the program of investment status and the results achieved i.e., the balance sheet and P& L a/c. Objectives of Financial Statement Analysis: To help in constructing future plans To gauge the earning capacity of the firm To assess the financial position and performance of the company To know the #solvency status of the firm To determine the #progress of the firm As a basis for #taxation and fiscal policy To ensure the legality of #dividends Financial Statement Analysis Tools Comparative Statements Common Size Statements #Trend Analysis #Ratio Analysis Fund Flow Statement Cash Flow Statement Types of Financial Analysis Intra-Firm Comparison Inter-firm Comparison Industry Average or Standard Analysis Horizontal Analysis Vertical Analysis Limitations Lack of Precision Lack of Exactness Incomplete Information Interim Reports Hiding of Real Position or Window Dressing Lack of Comparability Historical...
Posted by Managementguru in Accounting, Financial Management, Management Accounting, Principles of Management
on Mar 29th, 2014 | 0 comments

Profitability ratios are metrics that assess a company’s ability to generate income relative to its revenue, operating costs, balance sheet assets, or shareholders’ equity. Profitability ratios show how efficiently a company generates profit and value for shareholders. Accounting Basics for Success in Business and in Life! In general two groups of profitability ratios are calculated. Profitability in relation to sales.Profitability in relation to investments. Profitability Ratios can be Classified into five types Gross profit margin or ratioNet profit margin or ratioOperating profit margin or ratioReturn on AssetsReturn on Equity 1. GROSS PROFIT MARGIN OR RATIO It measures the relationship between gross profit and sales. It is calculated by dividing gross profit by sales. Gross profit margin or ratio = Gross profit X 100 / Net salesGross profit is the difference between sales and cost of goods sold. 2. NET PROFIT MARGIN OR RATIO It measures the relationship between net profit and sales of a firm. It indicates management’s efficiency in manufacturing, administrating, and selling the products. It is calculated by dividing net profit after tax by sales. Net profit margin or ratio = Earning after tax X 100 / Net Sales 3. OPERATING PROFIT MARGIN OR RATIO It establishes the relationship between total operating expenses and net sales. It is calculated by dividing operating expenses by the net sales. Operating profit margin or ratio = Operating costs X 100 / Net sales (0r) Cost of goods sold + Operating expenses * 100 / Net sales Operating expenses includes cost of goods produced/sold, general and administrative expenses, selling and distributive expenses. 4. RETURN ON ASSETS Return on assets is the ratio that is used to measure the company’s ability to generate profit by using its whole resource, the assets. It shows the percentage of the net income or net profit comparing to the average total assets. Return on assets shows how efficient the company is in using the assets to generate profits in a period of time. The high return on assets usually shows that the company performs well in making a profit from the assets it has. Return on assets can be calculated by comparing net income or net profit after interest and tax in the period to average total assets. Return on Assets = Net Profit / Average Total Assets 5. RETURN ON EQUITY Return on equity is the ratio that is used to measure the company’s ability to generate profit by using its investors’ money. It shows the percentage of the net income or net profit comparing to the average total equity. Return on equity shows how efficient the company is in using the investor’s money to generate profits in a period of time. The high return on equity usually shows that the company performs well in making profits from its investors’ money. Return on equity can be calculated by comparing net income or net profit after interest and tax in the period to average total equity. Return on Equity = Net Profit / Average Total...