Posted by Managementguru in Financial Accounting, Financial Management, Management Accounting
on Apr 3rd, 2014 | 0 comments
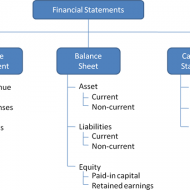
Ratio Calculation From Financial Statement Profit and Loss a/c of Beta Manufacturing Company for the year ended 31st March 2010. Exercise Problem1 Kindly download this link to view the exercise. Given in pdf format. You are required to find out: a) #Gross Profit Ratio b) #Net Profit Ratio c) #Operating Ratio d) Operating #Net Profit to Net Sales Ratio a. GROSS FORFIT RATIO = Gross profit ÷ #Sales × 100 = 50,000 ÷ 1,60,000 × 100 = 31.25 % b. #NET PROFIT RATIO = Net profit ÷ Sales × 100 = 28,000 ÷ 1,60,000 × 100 = 17.5 % c. OPERATING RATIO = #Cost of goods sold + Operating expenses ÷ Sales × 100 Cost of goos sold = Sales – Gross profit = 1,60,000 – 50,000 = Rs. 1,10,000 Operating expenses = 4,000 + 22,800 + 1,200 = Rs. 28,000 Operating ratio = 1,10,000 + 28,000 ÷ 1,60,000 × 100 = 86.25 % d. OPERATING NET PROFIT TO NET SALES RATIO = Operating Profit ÷ Sales × 100 Operating profit = Net profit + Non-Operating expenses – Non operating income = 28,000 + 800 – 4,800 = Rs. 32,000 Operating Net Profit to Net Sales Ratio = 32,000 ÷ 1,60,000 × 100 = 20 % What is a Financial statement? It is an organised collection of data according to logical and consistent #accounting procedure. It combines statements of balance sheet, income and retained earnings. These are prepared for the purpose of presenting a periodical report on the program of investment status and the results achieved i.e., the balance sheet and P& L a/c. Objectives of Financial Statement Analysis: To help in constructing future plans To gauge the earning capacity of the firm To assess the financial position and performance of the company To know the #solvency status of the firm To determine the #progress of the firm As a basis for #taxation and fiscal policy To ensure the legality of #dividends Financial Statement Analysis Tools Comparative Statements Common Size Statements #Trend Analysis #Ratio Analysis Fund Flow Statement Cash Flow Statement Types of Financial Analysis Intra-Firm Comparison Inter-firm Comparison Industry Average or Standard Analysis Horizontal Analysis Vertical Analysis Limitations Lack of Precision Lack of Exactness Incomplete Information Interim Reports Hiding of Real Position or Window Dressing Lack of Comparability Historical...

Posted by Managementguru in Accounting, Decision Making, Financial Management, Management Accounting, Principles of Management
on Mar 30th, 2014 | 0 comments

TURNOVER RATIO OR ACTIVITY RATIO or ASSET MANAGEMENT RATIO Turnover ratios are also known as activity ratios or efficiency ratios with which a firm manages its current assets. The following turnover ratios can be calculated to judge the effectiveness of asset use. Inventory Turnover Ratio Debtor Turnover Ratio Creditor Turnover Ratio Assets Turnover Ratio 1. INVENTORY TURNOVER RATIO This ratio indicates whether investment in stock is efficiently used or not, in other words, the number of times the inventory has been converted into sales during the period. Thus it evaluates the efficiency of the firm in managing its inventory. It helps the financial manager to evaluate the inventory policy. It is calculated by dividing the cost of goods sold by average inventory. Inventory Turnover Ratio = Cost of goods sold / Average Inventory (or) Net Sales / Average Stock Cost of goods sold = Sales-Gross profit Average Stock =Opening stock + Closing stock/2 2. DEBTOR TURNOVER RATIO Debtors play a vital role in current assets and to a great extent determines the liquidity of a firm. This indicates the number of times average debtors have been converted into cash during a year. It is determined by dividing the net credit sales by average debtors. Debtor Turnover Ratio = Net Credit Sales / Average Trade Debtors (or) Net Credit Sales / Average Debtors – Average Bills Receivable Net credit sales = Total sales – (Cash sales + Sales return) Total debtors = [ Op.Dr. + Cl.Dr. / 2 + Op.B/R + Cl. B/R / 2] When the information about credit sales, opening and closing balances of trade debtors is not available then the ratio can be calculated by dividing total sales by closing balances of trade debtor Debtor Turnover Ratio = Total Sales / Trade Debtors Note: Bad and doubtful doubts and their provisions are not deducted from the total debtors. The higher ratio indicates that debts are being collected promptly. 3. CREDITOR TURNOVER RATIO This is also known as “Creditors Velocity”. It indicates the number of times sundry creditors have been paid during a year. It is calculated to judge the requirements of cash for paying sundry creditors. It is calculated by dividing the net credit purchases by average creditors. Creditor Turnover Ratio = Net Credit Purchases / Average Trade Creditor (or) Net Credit Purchases / Average Creditors + Average Bills Payable Net credit purchases = Total purchases – (Cash purchase + Purchase return) Total Creditors = [Op.Cr. + Cl.Cr. / 2 + Op. B/P + Cl. B/P / 2] The higher ratio should indicate that the payments are made promptly. Net credit purchases consist of gross credit purchases minus purchase return. When the information about credit purchases, opening and closing balances of trade creditors is not available then the ratio is calculated by dividing total purchases by the closing balance of trade creditors. Creditor Turnover Ratio = Total purchases / Total Trade Creditors 4. ASSETS TURNOVER RATIO The relationship between assets and sales is known as assets turnover ratio. Several assets turnover ratios can be calculated depending upon the groups of assets, which are related to sales. a) Total asset turnover. b) Net asset turnover c) Fixed asset turnover d) Current asset turnover e) Net working capital turnover ratio a. TOTAL ASSET TURNOVER This ratio shows the firms ability to generate sales from all financial resources committed to total assets. It is calculated by dividing sales by total assets. Total asset turnover = Total Sales / Total Assets b. NET ASSET TURNOVER This is calculated by dividing sales by net assets. Net asset turnover =Total Sales / Net Assets Net assets represent total assets minus current liabilities. Intangible and fictitious assets like goodwill, patents, accumulated losses, deferred expenditure may be excluded for...
Posted by Managementguru in Accounting, Financial Management, Management Accounting, Principles of Management
on Mar 30th, 2014 | 0 comments

SOLVENCY OR LEVERAGE RATIOS Long-term solvency ratios analyze the long-term financial position of the organization. Bankers and creditors are interested in the liquidity of the firm, whereas shareholders, debenture holders and financial institutions are concerned with the long term prosperity of the firm. There are thus two aspects of the long-term solvency of a firm. Ability to repay the principal amount when due Regular payment of the interest. The ratio is based on the relationship between borrowed funds and owner’s capital it is computed from the balance sheet, the second type is calculated from the profit and loss a/c. The various solvency ratios are Debt equity ratio Debt to total capital ratio Proprietary (Equity) ratio Fixed assets to net worth ratio Fixed assets to long term funds ratio Debt service (Interest coverage) ratio 1. DEBT EQUITY RATIO OR EXTERNAL – INTERNAL EQUITY RATIO Debt equity ratio shows the relative claims of creditors (Outsiders) and owners (Interest) against the assets of the firm. The relationship between borrowed fund and capital is shown in debt-equity ratio. It can be calculated by dividing outsider funds (Debt) by shareholder funds (Equity) Ebt equity ratio = Outsider Funds (Total Debts) / Shareholder Funds or Equity (or) Long-term Debts / Shareholders funds Shareholders fund = Preference capital + Equity capital + Reserves & Surplus – Goodwill & Preliminary expenses Outsiders funds = Current liabilities + Debentures + Loans The ideal ratio is 2:1. High ratio means, the claim of creditors is greater than owners and vice-versa 2. DEBT TO TOTAL CAPITAL RATIO Debt to total capital ratio = Total Debts / Total Assets 3. PROPRIETARY (EQUITY) RATIO This ratio indicates the proportion of total assets financed by owners. It is calculated by dividing proprietor (Shareholder) funds by total assets. Proprietary (equity) ratio = Shareholder funds / Total Tangible assets The ideal ratio is 1:3. A ratio below 50% may be alarming for creditors, because they incur loss during winding up. 4. FIXED ASSETS TO NET WORTH RATIO This ratio establishes the relationship between fixed assets and shareholder funds. It is calculated by dividing fixed assets by shareholder funds. Fixed assets to net worth ratio = Fixed Assets X 100 / Net Worth The shareholder funds include equity share capital, preference share capital, reserves and surplus including accumulated profits. However fictitious assets like accumulated deferred expenses etc should be deducted from the total of these items to shareholder funds. The shareholder funds so calculated are known as net worth of the business. 5. FIXED ASSETS TO LONG TERM FUNDS RATIO Fixed assets to long term funds ratio establishes the relationship between fixed assets and long-term funds and is calculated by dividing fixed assets by long term funds. Fixed assets to long term funds ratio = Fixed Assets X 100 / Long-term Funds 6. DEBT SERVICE (INTEREST COVERAGE) RATIO This shows the number of times the earnings of the firms are able to cover the fixed interest liability of the firm. This ratio therefore is also known as Interest coverage or time interest earned ratio. It is calculated by dividing the earnings before interest and tax (EBIT) by interest charges on loans. Debt Service Ratio = Earnings before interest and tax (EBIT) / Interest...
Posted by Managementguru in Economics
on Feb 16th, 2014 | 0 comments

Monetary and Fiscal Policy Countries worldwide are concerned about the following issues while setting up monetary and fiscal policies; namely, the appropriate level of aggregate demand and the best blend of monetary and fiscal mix. Monetary policy focuses on the movement of money within the country, the inflow of foreign exchange and varying interest rates fixed by the Reserve Bank. Fiscal policies are concerned about stabilizing the economy and handle public revenue, expenditure and debts. The pattern of resource allocation and distribution of income affect the drafting of fiscal policies. Monetary policy is very well restricted by the government’s decision on public expenditure and taxation. The tactical combination of both will help determine the composition of GDP. The purpose of monetary policy: The purpose of monetary policy is to ensure availability of credit to the productive sectors of the economy and also regulation of money supply. Econometric models, which use statistical techniques to assess the impact of monetary policy changes on the macro economy, usually find that changes in money supply have a major impact on production in the short term, with greater impact on the proportion of nominal GDP in terms of wage and price inertia as time progresses. Annual budgets are always a nightmare for the common people as tax imposed on commodities has a say on their disposable income. For example, if the price of crude oil is on the rise, the government can do nothing but to increase the fuel prices. Inflation leads to an increase in interest rates charged by banks nationalized or private, affecting small-and medium-scale business firms. Some terminologies related to monetary policy: Let us get ourselves familiar with some of the terminologies in connection with monetary policy. This may help you to understand the subject in a better way. Repo rate: Rate at which RBI lends to other banks against securities Reverse Repo Rate: Rate at which RBI borrows from other banks Cash Reserve Ratio (CRR): Amount of money to be set aside by the banks with RBI against their deposits Statutory Liquidity Ratio (SLR): Percentage of bank funds to be maintained in government securities Capital Adequacy Ratio: Capacity of banks to work within the time line and risks. Bank Rate: Minimum interest rate at which the Central Bank offers commercial loans to other banks Inflation: Steady rise in prices of commodities Money Supply: Sum total of money circulating in the economy Money flow, policy variables and liquidity conditions have a direct bearing on savings, investment, consumption, inflation, employment and GDP.The ability of a country to improve its standard of living over time depends almost entirely on its ability to improve technology and capital used by the workforce. In short, the budget deficit should be reduced, which guarantees the rate of national savings and increased purchasing power parity (PPP). Main objectives of monetary policy: There have been changes in the objectives of monetary policy from time to time and vary from country to country. Sometimes the monetary policy adopted by a country may have different objectives, which are contradictory. In such cases, the country may have to compromise by setting the priorities. Some of the main objectives of monetary policy: • Price stability • Exchange rate stability • Full employment • High rate of economic growth • Equitable distribution of income Main objectives of Fiscal Policy: Post the Great Depression of the 1930s, it was well realized that governments should actively participate in economic activities to achieve economic growth and equity, through sound fiscal policies. The purpose of fiscal policy lies in: • Achieving full employment • The maintenance of stability • Increasing the rate of capital formation • Development of a model of...