Posted by Managementguru in Interview Questions, Resume Samples
on Apr 6th, 2014 | 0 comments

Resume for Sales Know the purpose of your resume Need help in creating or updating your resume? It certainly can be a tough task because your resume is going to be reviewed by software as well as by hiring managers. This new column brings you top resume tips for choosing a resume format, selecting a resume font, customizing your resume, using resume keywords, explaining employment gaps, and more tips for writing interview winning resumes. Try to understand that the purpose of building your resume is to land an interview and make it as precise as possible and impress the recruiters with your profile. Business and Marketing Writing A great resume is one that highlights your strengths and emphasizes the highs of your career. It is imperative for every professional to get his resume periodically updated to move up the corporate ladder. A resume has four sections: Personal Information. This includes your full name, city, contact number, e-mail address and social media profiles. Your personal information can appear at the top center part of the resume with a header positioned below it. Employment History. Your work history must be arranged beginning from current or most recent employer. It must indicate your designation, inclusive dates of employment and a description of your scope of responsibilities. Educational Attainment. This should also be arranged according to highest level of education attained. Details should include degree earned, inclusive dates and relevant awards or achievements. You do not have to include information from secondary education and earlier. Special Skills. This section is where you highlight core competencies and other skills you have that are relevant to the job opening. What are the key ingredients of a great resume? A sparkling profile with sufficient emphasis on your key strengths. A cover letter that guarantees a personal interview. Customized and tailor-made resumes. Designed by skilled resume writing experts. Professional formatting and layout. What should be there in a profile statement? Understand that highlighting your skills and experience in your profile is the “Catch Point” to impress your new recruiters. Financial Planning and Strategy, Marketing Concepts, Positioning, People Management, Territory Management, Sales Planning, Competitive Analysis, Understanding the Customer, Product Development, Client Relationships, Creative Services are some of the criteria that make a marketing/sales manager stand out from the crowd. Try to bring out the achievements in your career till date and who might be the better master to do it other than yourself! Q: What’s the most common resume mistake? A: Making too many general claims and using too much industry jargon that does not market the candidate. A resume is a marketing document designed to sell your skills and strengths rather than just portray a bio of the candidate. For unemployed candidates, handing out resumes should be a full-time job. The majority of mid- to senior-level positions are filled through networking, so contact absolutely everyone you know in addition to recruiters who are in a position to hire you or share...

Posted by Managementguru in Financial Accounting, Financial Management, Management Accounting
on Apr 3rd, 2014 | 0 comments
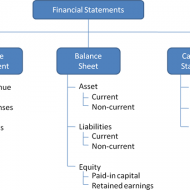
Ratio Calculation From Financial Statement Profit and Loss a/c of Beta Manufacturing Company for the year ended 31st March 2010. Exercise Problem1 Kindly download this link to view the exercise. Given in pdf format. You are required to find out: a) #Gross Profit Ratio b) #Net Profit Ratio c) #Operating Ratio d) Operating #Net Profit to Net Sales Ratio a. GROSS FORFIT RATIO = Gross profit ÷ #Sales × 100 = 50,000 ÷ 1,60,000 × 100 = 31.25 % b. #NET PROFIT RATIO = Net profit ÷ Sales × 100 = 28,000 ÷ 1,60,000 × 100 = 17.5 % c. OPERATING RATIO = #Cost of goods sold + Operating expenses ÷ Sales × 100 Cost of goos sold = Sales – Gross profit = 1,60,000 – 50,000 = Rs. 1,10,000 Operating expenses = 4,000 + 22,800 + 1,200 = Rs. 28,000 Operating ratio = 1,10,000 + 28,000 ÷ 1,60,000 × 100 = 86.25 % d. OPERATING NET PROFIT TO NET SALES RATIO = Operating Profit ÷ Sales × 100 Operating profit = Net profit + Non-Operating expenses – Non operating income = 28,000 + 800 – 4,800 = Rs. 32,000 Operating Net Profit to Net Sales Ratio = 32,000 ÷ 1,60,000 × 100 = 20 % What is a Financial statement? It is an organised collection of data according to logical and consistent #accounting procedure. It combines statements of balance sheet, income and retained earnings. These are prepared for the purpose of presenting a periodical report on the program of investment status and the results achieved i.e., the balance sheet and P& L a/c. Objectives of Financial Statement Analysis: To help in constructing future plans To gauge the earning capacity of the firm To assess the financial position and performance of the company To know the #solvency status of the firm To determine the #progress of the firm As a basis for #taxation and fiscal policy To ensure the legality of #dividends Financial Statement Analysis Tools Comparative Statements Common Size Statements #Trend Analysis #Ratio Analysis Fund Flow Statement Cash Flow Statement Types of Financial Analysis Intra-Firm Comparison Inter-firm Comparison Industry Average or Standard Analysis Horizontal Analysis Vertical Analysis Limitations Lack of Precision Lack of Exactness Incomplete Information Interim Reports Hiding of Real Position or Window Dressing Lack of Comparability Historical...
Posted by Managementguru in Accounting, Decision Making, Management Accounting, Project Management
on Apr 1st, 2014 | 0 comments
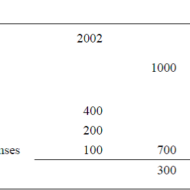
ACCOUNTING AND DECISION MAKING – IDENTIFYING THE PROBLEM SITUATION Learn accounting and finance basics so you can effectively analyze business data to make key management decisions. Business owners are faced with countless decisions every business day. Managerial accounting information provides data-driven input to these decisions, which can improve decision-making over the long term. Fig 1.1- ACCOUNTING INFORMATION FOR A SINGLE PRODUCT The above illustration clearly depicts that there has been a loss of Rs.100 in one year’s time for this particular product. The reason can be attributed to the increase in the “cost of goods” whereas other expenses have remained the same in both the years. For a single product manufactured, the problem is identifiable and solvable. But when the organization is producing a range of products, you need to apply some accounting technique by which the product losing money is identified and suitable measures are taken to cut down the escalating cost. Fig 1.2- Accouning Information for a Product Range The above illustration compares and contrasts the relationship of three products a company manufactures. It is seen that products P1 and P2 are doing well. Though the cost of sales has gone up for P1 and P2, the sales volume has also increased thus increasing the gross profit over the period of time. Here the product that has to be dealt with is P3 whose sales volume has drastically gone down, yet with the same cost of sales. When there is an increase in cost of sales, two things have to be considered. Identifying the problem-product Either cut down the production cost or increase the selling-price if the product has a real demand in the market. Uses of Accounting Data: Accounting information helps the management to arrive at make or buy decisions, to outsource production of certain components to cut down or control costs, to expand the production, to increase the sales volume or to downsize their project capacity. Techniques like Break-Even Analysis, Costing and Budgeting aid in going for the right production-mix, marketing-mix and sales target plans for the respective financial years. Aggregate Planning: As we all know planning is the key to the future and financial planning has to be given utmost importance for a production process. Aggregate planning involves translating long-term forecasted demand into specific production rates and the corresponding labor requirements for the intermediate term. It takes into consideration a period of 6 to 18 months, breaking it into work modules weekly or monthly and planning for the specific period in terms of men, material and...
Posted by Managementguru in Accounting, Decision Making, Financial Management, Management Accounting, Principles of Management
on Mar 30th, 2014 | 0 comments

TURNOVER RATIO OR ACTIVITY RATIO or ASSET MANAGEMENT RATIO Turnover ratios are also known as activity ratios or efficiency ratios with which a firm manages its current assets. The following turnover ratios can be calculated to judge the effectiveness of asset use. Inventory Turnover Ratio Debtor Turnover Ratio Creditor Turnover Ratio Assets Turnover Ratio 1. INVENTORY TURNOVER RATIO This ratio indicates whether investment in stock is efficiently used or not, in other words, the number of times the inventory has been converted into sales during the period. Thus it evaluates the efficiency of the firm in managing its inventory. It helps the financial manager to evaluate the inventory policy. It is calculated by dividing the cost of goods sold by average inventory. Inventory Turnover Ratio = Cost of goods sold / Average Inventory (or) Net Sales / Average Stock Cost of goods sold = Sales-Gross profit Average Stock =Opening stock + Closing stock/2 2. DEBTOR TURNOVER RATIO Debtors play a vital role in current assets and to a great extent determines the liquidity of a firm. This indicates the number of times average debtors have been converted into cash during a year. It is determined by dividing the net credit sales by average debtors. Debtor Turnover Ratio = Net Credit Sales / Average Trade Debtors (or) Net Credit Sales / Average Debtors – Average Bills Receivable Net credit sales = Total sales – (Cash sales + Sales return) Total debtors = [ Op.Dr. + Cl.Dr. / 2 + Op.B/R + Cl. B/R / 2] When the information about credit sales, opening and closing balances of trade debtors is not available then the ratio can be calculated by dividing total sales by closing balances of trade debtor Debtor Turnover Ratio = Total Sales / Trade Debtors Note: Bad and doubtful doubts and their provisions are not deducted from the total debtors. The higher ratio indicates that debts are being collected promptly. 3. CREDITOR TURNOVER RATIO This is also known as “Creditors Velocity”. It indicates the number of times sundry creditors have been paid during a year. It is calculated to judge the requirements of cash for paying sundry creditors. It is calculated by dividing the net credit purchases by average creditors. Creditor Turnover Ratio = Net Credit Purchases / Average Trade Creditor (or) Net Credit Purchases / Average Creditors + Average Bills Payable Net credit purchases = Total purchases – (Cash purchase + Purchase return) Total Creditors = [Op.Cr. + Cl.Cr. / 2 + Op. B/P + Cl. B/P / 2] The higher ratio should indicate that the payments are made promptly. Net credit purchases consist of gross credit purchases minus purchase return. When the information about credit purchases, opening and closing balances of trade creditors is not available then the ratio is calculated by dividing total purchases by the closing balance of trade creditors. Creditor Turnover Ratio = Total purchases / Total Trade Creditors 4. ASSETS TURNOVER RATIO The relationship between assets and sales is known as assets turnover ratio. Several assets turnover ratios can be calculated depending upon the groups of assets, which are related to sales. a) Total asset turnover. b) Net asset turnover c) Fixed asset turnover d) Current asset turnover e) Net working capital turnover ratio a. TOTAL ASSET TURNOVER This ratio shows the firms ability to generate sales from all financial resources committed to total assets. It is calculated by dividing sales by total assets. Total asset turnover = Total Sales / Total Assets b. NET ASSET TURNOVER This is calculated by dividing sales by net assets. Net asset turnover =Total Sales / Net Assets Net assets represent total assets minus current liabilities. Intangible and fictitious assets like goodwill, patents, accumulated losses, deferred expenditure may be excluded for...
Posted by Managementguru in Accounting, Financial Management, Management Accounting, Principles of Management
on Mar 29th, 2014 | 0 comments

Profitability ratios are metrics that assess a company’s ability to generate income relative to its revenue, operating costs, balance sheet assets, or shareholders’ equity. Profitability ratios show how efficiently a company generates profit and value for shareholders. Accounting Basics for Success in Business and in Life! In general two groups of profitability ratios are calculated. Profitability in relation to sales.Profitability in relation to investments. Profitability Ratios can be Classified into five types Gross profit margin or ratioNet profit margin or ratioOperating profit margin or ratioReturn on AssetsReturn on Equity 1. GROSS PROFIT MARGIN OR RATIO It measures the relationship between gross profit and sales. It is calculated by dividing gross profit by sales. Gross profit margin or ratio = Gross profit X 100 / Net salesGross profit is the difference between sales and cost of goods sold. 2. NET PROFIT MARGIN OR RATIO It measures the relationship between net profit and sales of a firm. It indicates management’s efficiency in manufacturing, administrating, and selling the products. It is calculated by dividing net profit after tax by sales. Net profit margin or ratio = Earning after tax X 100 / Net Sales 3. OPERATING PROFIT MARGIN OR RATIO It establishes the relationship between total operating expenses and net sales. It is calculated by dividing operating expenses by the net sales. Operating profit margin or ratio = Operating costs X 100 / Net sales (0r) Cost of goods sold + Operating expenses * 100 / Net sales Operating expenses includes cost of goods produced/sold, general and administrative expenses, selling and distributive expenses. 4. RETURN ON ASSETS Return on assets is the ratio that is used to measure the company’s ability to generate profit by using its whole resource, the assets. It shows the percentage of the net income or net profit comparing to the average total assets. Return on assets shows how efficient the company is in using the assets to generate profits in a period of time. The high return on assets usually shows that the company performs well in making a profit from the assets it has. Return on assets can be calculated by comparing net income or net profit after interest and tax in the period to average total assets. Return on Assets = Net Profit / Average Total Assets 5. RETURN ON EQUITY Return on equity is the ratio that is used to measure the company’s ability to generate profit by using its investors’ money. It shows the percentage of the net income or net profit comparing to the average total equity. Return on equity shows how efficient the company is in using the investor’s money to generate profits in a period of time. The high return on equity usually shows that the company performs well in making profits from its investors’ money. Return on equity can be calculated by comparing net income or net profit after interest and tax in the period to average total equity. Return on Equity = Net Profit / Average Total...